The Money Tree

Safely Generating Income in Retirement

Long Term Portfolio – Q3 Update

Posted by mounddweller on September 29, 2018

Fellow investors,

Here’s an update on my long-term stock portfolio at the end of Q3.  Readers will recall this is my portfolio of MLPs and dividend growth stocks.  In Q3 I added to one stock in my holdings, I purchased an additional 100 shares of AT&T (T) at a net cost of $3,117.95.  I think adding to T enhances my long-term holdings, especially at the bargain price at which I was able to acquire it.  My yield on cost (YoC) is a substantial 6.76%.  There’s been a lot of speculation about T’s ability to service its debt and continuing to pay a hefty dividend after acquiring Time Warner.  However, having worked directly with executives and the professionals in the Finance Department at T for many years I have confidence in their analytical abilities and conservative judgement.

Now let’s take a look at what’s been going on with the rest of the portfolio.  Most, but not all, of my holdings have continued to participate in the US stock market’s trending higher.  This has resulted in the total value of my long-term portfolio increasing by 4.23% in Q3 and  9.02% YTD in 2018 (after accounting for the purchase of additional shares in T).

A couple of my holdings announced dividend increases in Q3.  The net effect is my annualized dividends have increased by $344.29, a little over half of which comes from my additional shares of T.  My YoC across all of my long-term portfolio increased to 7.74%.

The Long-Term Portfolio tab contains a chart showing all of my holdings and their performance to date.

Regards,

Troy

Posted in Long Term Holdings | Leave a Comment »

New Trade – L Brands (LB)

Posted by mounddweller on August 9, 2018

Fellow Investors,

Today I initiated a new kind of trade.  It has two parts, one consists of being long the stock and the other is being short puts.  The strategy involves identifying and taking advantage of repeatable patterns of seasonality in the movement of a particular stock’s price.  Not all stocks exhibit this type of seasonality but those that do can be traded for short-term profits.

The stock I chose for my first attempt at this type of trade is LB, L Brands.  LB is one of those currently out of favor retailers.  It has two major chains, Victoria’s Secret and Bath & Body Works.  It also operates two smaller chains, Pink and Henri Bendel.  It also has an international segment for its Victoria’s Secret and Bath & Body Works stores located outside the U.S.

I chose LB as my first try for this type of trade for two reasons, (1) it is currently trading at a very depressed price, and (2) it exhibits a particularly strong period of seasonality.

First, let’s talk about the reasons for the very depressed price.  Currently, sales at domestic Victoria’s Secret locations are faltering.  Same store sales comps are declining.  Victoria’s Secret generated more than half of L Brands yearly revenue, 58.5% in 2017.  Thus, Mr. Market is worried.  However, I think Mr. Market has overreacted.  Since peaking at $62.95 at the close on December 26, 2017 LB has fallen 50%.  It closed today at $31.51.  However, the other 41.5% of L Brands business is doing just fine.  Sales at Bath & Body Works are doing particularly well.  International operations are also doing well, including those of Victoria’s Secret.  The result is that the company remains solidly profitable.  In Mr. Market’s defense there are a couple of other risks that are being priced in, (1) LB has doubled its long-term debt over the past 8 years, and (2) it pays a quarterly dividend of $0.60 which is currently just barely being covered by free cash flow.

Below you’ll find a couple of charts showing key financial information.  In looking them over I think you’ll reach the same conclusion I did, the situation isn’t nearly as dire as Mr. Market would have you believe.

Earlier today L Brands announced its July sales.  The news continues to be bad for Victoria’s Secret but overall it was a positive report.

  • It reported overall sales increased 10.7% Y/Y to $849.7M in July.
  • Comparable sales were flat for the month. Comparable sales fell 2% if only the chain’s stores are tallied up.
  • Bath & Body Works saw a 10% increase in comparable sales, while Victoria’s Secret turned a -4% comp.
  • The company says it expects to report Q2 EPS toward the high end of its previous guidance range of $0.30 to $0.35 per share.

These results further strengthened my belief that results will overall continue to be favorable in the upcoming all important 3rd and 4th quarters of 2018.  This bodes well for a strong performance in its seasonally favorable period which generally runs from August through December.

Over the past 10 years the stock price of L Brands has done very well in the last 5 months of the year.  Initiating a trade on the first trading day in August and closing it on the last trading day of the year in December yielded the following results.

As you can see this trade over the past 10 years has been successful 80% of the time.  We all know what was happening in 2008 so it shouldn’t be a surprise to see that initiating this trade that year would have resulted in a large loss.  A far smaller loss would have been recorded in 2016.  In 2012 the result would have been a very small gain had it not been for the payment of a $3.00 special dividend.

Now, let’s discuss the specifics of the trades I placed earlier today.  As I mentioned in the opening paragraph it has two parts.  First, I purchased 100 shares of LB at a price of $32.20.  The stock faltered later in the day.  Had I been a bit more patient I could have gotten in a bit lower.  It closed today at $31.51.  The second part of the trade consisted of selling to open (STO) two JAN 2019 put at a strike price of $30.  The premium on each was $2.40.

I think it is reasonable to expect that LB will perform similarly to last year in this seasonally favorable period.  Thus, my target price by year-end for LB is $40.  Should LB get to $40 my ROIC (inclusive of the two $0.60 dividends to be paid in September and December) would be 27.95%.  Annualized my return would be 71.3%.

Now let’s look at the potential returns of my two short puts.  Should they expire out of the money (OOM) on January 18, 2019 my ROIC will be 8%.  Annualized my return would be 17.9%.

Now let’s look at the downside potential of this trade.  If the stock doesn’t perform as expected what does my downside look like?  I can’t see it falling significantly below $30 but let’s assume I have the stock put to me at $30 in January and that I continue to hold the original 100 shares purchased at $32.20.  My net cost on the assigned 200 shares will be $27.60 ($30 – 2.40).  My net cost basis on the 300 shares will be $29.13.  The stock currently pays $2.40 in dividends ($0.60 per quarter).  Thus, the dividend yield on my 300 shares would be 8.2%.  I can then either choose to continue to hold the stock and collect the substantial dividend or I can begin selling $30 covered call options until I get called away.

Only time will tell how my initial foray into trading seasonality turns out.

Best Regards,

Troy

Posted in Troy's New Picks! | Tagged: | Leave a Comment »

Long-Term Portfolio – Q2 Update

Posted by mounddweller on July 12, 2018

Fellow investors,

I’m late in providing a Q2 update on my long-term portfolio.  Readers will recall this is my portfolio of MLPs and dividend growth stocks.  In Q2 I added one stock to my holdings, a 100 share purchase of Dominion Energy (D) at a net cost of $6,339.95.  I think D is a great addition to my long-term holdings, especially at the bargain price at which I was able to acquire it.  My initial yield on cost (YoC) is a substantial 5.27%.  Better yet, management at Dominion have targeted 10% dividend growth through 2020 followed by a minimum of 5% thereafter.  Consequently, if D’s management successfully reaches their objective, my YoC in 2020 will have grown to a minimum of 6.37%.

Now let’s take a look at what’s been going on with the rest of the portfolio.  Most, but not all, of my holdings have continued to participate in the US stock market’s trending higher.  This has resulted in the total value of my long-term portfolio increasing by 5.7% in the first 6 months of 2018 (after accounting for the acquisition of D).

Several of my holdings announced dividend increases in Q2.  The net effect is my annualized dividends have increased by $816.43, a little over half of which comes from my addition of KMI and D to the portfolio.  My YoC across all of my long-term portfolio increased from 7.52% to 7.63%.

The Long-Term Portfolio tab contains a chart showing all of my holdings and their performance to date.

Regards,

Troy


Posted in Long Term Holdings | 2 Comments »

New Additions to my Real Estate Holdings

Posted by mounddweller on June 11, 2018

Fellow Investors,

Over the past 3 years I have begun investing in commercial real estate.  My primary objective is current income.  Capital appreciation is secondary.  Return of capital is of paramount importance.  My first couple of investments in this space were via a good friend of a good friend, i.e., someone I could trust!  Since then, via the power of networking, I have expanded my circle of trusted business partners.  I now have half a dozen dedicated commercial real estate professionals who regularly present me with deals for my consideration.

You can see pictures and a few financial metrics for all of my real estate holdings under the current real estate tab above.

However, the purpose of this post is to tell you about two new investments that I’ve made in the past 30 days.  The first one is a 5 building industrial portfolio located in Florence, Kentucky (a suburb of Cincinnati, OH).

This portfolio consists of 5 buildings all located in the same business park near Cincinnati’s international airport.  The 5 buildings are fully leased with 8 solid tenants.  All of the leases are triple-net (NNN).  That means the tenant pays for all maintenance, operating expenses, etc.  The landlord simply collects monthly rent.

Here are the financial terms of the investment partnership which purchased this property.

  • Investors receive a ‘preferred return’ of 6% annually, paid quarterly.  Thus, before the Class A managing partner receives any return, the Class B investor partners must be paid their 6% preferred return.
  • After investors have received their 6% preferred return, remaining cash flows are split 50/50 between them and the Class A managing partner.
  • We intend to own this property for between 4-5 years.  Upon sale all profits will be split 75/25, the Class B investor partners receiving the 75%.
  • Pro-forma financials project a total annualized return of 19-20% over the life of the investment

Here are a few reasons why I chose to invest in this property:

  • The managing partner is someone whom I’ve successfully invested with previously.
  • Property is well situated in a rapidly growing, low vacancy area for industrial properties.
  • Secure, diversified and stabilized asset
  • At closing property was 100% leased and has a strong anchor tenant

My second acquisition is a portfolio of industrial buildings spread across 3 locations but having a single-tenant.  The tenant is a nationwide distributor of building products.  The buildings are located in Dallas, Lubbock, and San Antonio, Texas.  Once again the leases are absolute triple-net (NNN), i.e., zero landlord responsibilities.

Here is a picture of the Dallas location.

Here are the financial terms of the investment partnership which purchased this property.

  • Investors initially receive a ‘preferred return’ of 8% annually, paid quarterly.  Thus, before the Class A managing partner receives any return, the Class B investor partners must be paid their 6% preferred return.  The preferred return increases over time reaching a maximum of 10% by year 5.
  • We intend to own this property for between 5-10 years.  Upon sale all profits will be split 60/40, the Class B investor partners receiving the 60%.
  • Pro-forma financials project a total annualized return of 17-20% over the life of the investment

Here are a few reasons why I chose to invest in this property:

  • The managing partner is someone whom I’ve successfully invested with previously.
  • Tenant is well capitalized
  • Strong cash flows and increasing rents built into the lease terms

If you are unfamiliar with these types of commercial real estate investments and would like to know more, please do not hesitate to contact me.  I’ll be happy to share more details about how I got started with these types of investments, my experiences thus far, and provide more details as to how deals of this type are structured.

Happy Investing,

Troy


Posted in Portfolio Updates, Real Estate Holdings | Leave a Comment »

Procter & Gamble (PG)

Posted by mounddweller on April 21, 2018

Fellow Investors,

PG is not in my ‘top 10’ watch list for Dividend Kings simply because its revenue and dividend growth rates have been slowing while other Dividend Kings have not. However, most of the stocks in my ‘top 10’ watchlist are also far above my target buy price. PG is currently substantially below my target buy price. Thus, I am taking another look at PG.

To determine a target buy price for stocks to add to my long-term holdings portfolio I compute annual high/low dividend yields for the past 10 years and then average the annual high yields. Taking the current annual dividend and dividing it by the 10-year average high yield gives me a target buy price.

Let’s look at how this plays out with PG. PG has a 10-year average high yield of 3.5%. With the recently announced increase in the dividend in 2018 PG will pay out a total of $2.84 per share. Thus, my target buy price for PG would be $81.14.  PG closed on Friday at $73.80, a 9% discount to my target buy price.

PG’s highest dividend yield in the past 10 years was 4.05% which occurred in 2015. PG’s dividend yield for 2018 is now 3.84%, thus, higher than the 10-year average but not quite as high as available at its lows in 2015. That’s what makes PG an interesting potential buy at current prices. You get a blue-chip stock with a 62 year history of annual dividend increases at a dividend yield that exceeds its 10-year average high yield. In my mind the low price/high yield makes up for the slower growth rate relative to some of its other Dividend King peers.  Its dividend growth rate, while slowing over the past 3 years, still exceeds the rate of inflation.

Given the downward trend in price I will likely hold off for a while longer but anything below $70/share will be very hard to resist.  At $70/share the dividend yield would exceed 4%.

Best Regards,

Troy


Posted in Potential Trades | Tagged: | 1 Comment »

New Trade – Dominion Energy (D)

Posted by mounddweller on April 11, 2018

Fellow Investors,

I entered a new trade today; one that I hope will lead to a buy and addition to my long-term portfolio.  Specifically, I sold May $65 puts on Dominion Energy (D) for $1.65.  Before I tell you about my rationale and objectives for this trade please let me tell you a little bit about D.

Dominion Energy is a regulated utility holding company headquartered in Richmond, Virginia.  It engages in the provision of electricity and natural gas to homes, businesses, and wholesale customers. Its operations also include a regulated interstate natural gas transmission pipeline and underground storage system. It operates through following business segments: Power Delivery, Power Generation, and Gas Infrastructure. The Power Delivery segment regulates electric distribution and transmission. The Power Generation segment includes regulated electric fleet and merchant electric fleet. The Gas Infrastructure segment comprises gas transmission and storage, gas distribution and storage, liquefied natural gas import, and storage.

Dominion has a market capitalization of around $44 billion and generates about $12.5 billion per year in revenue.  It has about $37 billion in total debt.  It currently pays $3.34 per share annually in dividends.  Dividend growth has averaged 7.74% per year over the past 5 years.

Why am I interested in adding Dominion Energy to my long-term holdings?  First, and foremost it is a well run utility.  Second, I didn’t have any utility companies in my long-term holdings and felt that was a gap considering my overall objective of creating a steady, safe, yet growing source of dividend income.  Third, Dominion has strong growth prospects for the foreseeable future.  It has a stated goal of achieving 10% annual dividend growth through 2020 and then a minimum of 5% thereafter.

Why do I like Dominion at this time and price?  The simple answer is the current dividend yield.  At a $65 share price and $3.34 in annual dividends, D currently yields a substantial 5.14%.  This is the highest it has yielded since the great recession of 2008/09.  The current weakness in the stock price coupled with the company’s stated goal of 10% dividend growth through 2020 leads me to believe this is an excellent time to invest in Dominion.

So, why didn’t I just go long on Dominion stock rather than selling puts?  Two reasons. One, despite having support on the 3-year chart at $65, D could continue to fall in the short-term.  Thus, by selling puts, if assigned, I lower my cost basis down to $63.35.  Two, the ROIC on my cash secured puts was enticing.  $1.65 against a $65 strike price with a 38 day holding period gives me a cash on cash return of 2.54%. My annualized return is 24.4%.

Let’s look at the long-term potential for adding D to my portfolio.  As I previously mentioned, D intends to grow its dividend by at least 10% per year through 2020.  If they are successful in doing this the dividend in 2020 will be at least $4.04.  With a cost basis of $63.35 that would mean my yield on cost (YoC) in 2020 would be 6.4%.  Even better, it would continue to grow at around 5% per year thereafter.  That’s a darn good return for a stable, low risk investment.

If I don’t have D put to me at $65 at expiration, I will likely directly enter into a direct buy of the common stock, hopefully at a price less than $66.80, which equates to a 5% dividend yield.

Regards,

Troy


Posted in Long Term Holdings | Tagged: | Leave a Comment »

New Investment – KMI

Posted by mounddweller on March 30, 2018

Fellow Investors,

Over the past few weeks I have been looking to make one or two opportunistic additions to my long-term investment portfolio.  In a previous post I mentioned an interest in IBM and OKE.  I still have both of these on my radar screen.  However, my interest in OKE and the fact that mid-stream O&G companies in general have fallen out of favor on Wall Street led me to expand my research.  In addition to OKE, I also began to keep an eye on ENB and KMI.

All 3 companies are leaders in the mid-stream space of the O&G industry.  While I really like OKE, I decided to do more due diligence on ENB and KMI because, in my opinion, they represented a better value.  Then, after comparing ENB and KMI, I decided I liked KMI just a bit better than ENB for the following reasons:

(1) ENB pays dividends in Canadian dollars, thus there is a currency risk,

(2) KMI is further along in strengthening its balance sheet.

Thus, last week when it appeared pessimism was at a peak I made two trades.  First, I bought 200 shares of KMI at $14.84 per share.  Second, I STO 2 KMI SEP 15 puts at $1.30.  KMI currently pays a $0.50 dividend.  Thus, my initial dividend yield is 3.37%.  Nothing to get too excited about, right?  However, if you’ve followed KMI in the past you know that they have had a few rough years.  They grew too fast and incurred too much debt.  As recently as 2014 KMI had paid quarterly dividends at an annual rate of $2.00 per share.  In order to restructure their balance sheet and get back in the good graces of the analysts on Wall Street, they cut their dividend by 75% and used the savings to pay down debt and become self-funding.  By that I mean their plan going forward is to fund all of their future growth out of existing cash flow without having to access the debt or equity markets.  Having done that for the past couple of years KMI is now positioned to again begin growing its dividend.  For 2018, they have announced plans to increase the dividend from $0.50 to $0.80.  Barring unforeseen events the plan calls for further increases to $1.00 in 2019 and $1.25 in 2020.  If these plans come to fruition my yield on cost in 2020 will be a very impressive 8.42%.

Now, let’s take a look at the puts I sold.  As referenced above, I STO 2 KMI SEP 15 puts at $1.30.  I decided to sell these puts for a couple different reasons:

(1) I wanted to leg into a full position in KMI over time, and

(2) the relatively high VIX gave me an opportunity to make a higher ROIC than if I had just bought another 200 shares of stock.

Since these are cash secured puts my ROIC is 8.67% (1.3/15).  That is significantly higher than 5.39% (0.8/14.84) return I would have gotten had I just purchased the shares outright.  Better yet, my annualized return on the puts is 17.57%, since my maximum holding period is only 180 days.

If I have KMI shares put to me in SEP at $15, my cost basis will only be $13.70.  This will give me a yield on cost of 5.84% in 2018, 7.30% in 2019, and 9.12% in 2020.

At these prices and rates of return I am very happy to have added KMI to my long-term portfolio.  I am continuing to keep an eye on OKE and hope to make an equally attractive entry in it later this year.  I’d like to own OKE at $45 or less.  Thus, it will take a bit more volatility in the market before I can hope to achieve this price target.

Best Regards,

Troy


Posted in Long Term Holdings, Troy's New Picks! | Tagged: , , | Leave a Comment »

“Dividend House” – Lack of Diversification – A Rebuttal

Posted by mounddweller on March 1, 2018

Fellow Investors,

I received a comment on my recent post entitled Building a “Dividend House”.  The commentor took issue with the lack of sector diversification in the selections I had made for the foundation of a dividend growth and income (DGI) portfolio.  Specifically, he took issue with what he saw as an overweighting in the Consumer Goods sector and a lack of any positions in the Information Technology (IT) and Financial sectors.  The purpose of this post is to provide a rebuttal and explain why I feel diversification should not be an overriding concern in this type of portfolio.

First, let us recall the objective of the “Dividend House” portfolio.  The overall goal of the portfolio is to provide a safe and growing stream of income in retirement. A dividend king stock, regardless of its sector or industry has proven to be resilient in all kinds of markets and economic conditions. That is why they make great candidates for forming the foundation of a portfolio.  As long as you can reasonably expect its business model to continue to be successful and its growth to exceed the rate of inflation nothing else should really matter.

Now let us look more closely at the sectors and industries of the stocks I chose to include in the foundation portion of the “Dividend House” portfolio.

As shown above the stocks selected for the foundation of the “Dividend House” portfolio, despite diversification not being an objective, are spread across 5 different sectors and 9 different industries.  Why did I not select any stocks from the IT sector?  Simple, there are no dividend king stocks in that sector.  Why no financial stocks?  Well, of the 27 stocks classified as Dividend Kings, there are only 3 in the Finance sector, two banks and one insurance company.  They are Cincinnati Financial, Commerce Bancshares, and Farmer’s and Merchant’s Bank.  Their 10-year annualized dividend growth rates are respectively, 2.82%, 4.35%, and 2.72%.  Compare those rates to the 16.25% average dividend growth rate of the 10 selected stocks and it is easy to see why they weren’t chosen.  Choosing one of them simply for the purpose of diversification would have resulted in a higher probability of mediocre returns in the future.

There is one other rule you ought to keep in mind and that is to concentrate, and not only in the Zen sense. Sweet are the uses of diversity, but only if you want to end up in the middle of an average” Adam Smith, the Money Game 1968

If you can identify six wonderful businesses, that is all the diversification you need. And you will make a lot of money. And I can guarantee that going into a seventh one instead of putting more money into your first one is gotta be a terrible mistake. Very few people have gotten rich on their seventh best idea. But a lot of people have gotten rich with their best idea. So I would say for anyone working with normal capital who really knows the businesses they have gone into, six is plenty, and I probably have half of what I like best. I don‘t diversify personally. ” Warren Buffett

Now, one final point with regard to my rebuttal on the lack of diversification in the foundation of the “Dividend House” portfolio.  The total portfolio does not consist of just these 10 foundational stocks.  Readers of my original post will recall that the “Dividend House” will also have walls, a roof, and even a garden.  Perhaps the best stocks for these parts of the “Dividend House”, will include positions from the IT and Financial sectors, or perhaps not.  Like the foundation, those sections will include stocks that offer the best opportunity for high, safe dividend growth.


Best Regards,

Troy

Posted in Potential Trades | Leave a Comment »

Building a “Dividend House”

Posted by mounddweller on February 26, 2018

Fellow Investors,

I am a frequent reader of articles on Seeking Alpha (www.seekingalpha.com).  There are several superb analysts who write regularly on the site.  There are also an innumerable number of hacks.  It doesn’t take long to tell which is which.  There are also many individuals, like myself, who just like doing their own analysis and publishing the results.  One such individual goes by the non de plume, “Dividend House.”

“Dividend House” is a person nearing retirement age who decided to take the bull by the horns, divest her and her husband’s portfolios of mutual funds and start investing in dividend growth stocks (DGI).  In order to make sense of her portfolio she devised a wonderful analogy of the stocks in her portfolio as being sections of a house, i.e. foundation, walls, roof, etc.  If you’re so inclined you can read about her Dividend House model here: https://seekingalpha.com/article/3791466-build-dividend-house-stocks-go.

Recently, Dividend House, posted another article discussing the possible need to replace one of the stocks in the foundation portion of her portfolio.  The stock she was considering replacing was Owens & Minor (OMI).  OMI is a healthcare company with an excellent record of growing dividends.  However, in recent years, the turmoil in the healthcare industry has wreaked havoc on its business model and forced it to adapt or die.  For this reason Dividend House was considering removing it as a foundational stock.

After reviewing Dividend House’s criteria for foundational stocks and the overall methodology for building her portfolio, I made the following observations:

  • With over 60 stocks, she had too many stocks in her portfolio, and
  • Stocks that form the foundation of a portfolio should very rarely need to be sold.

I told her if it were my dividend house I would simplify the criteria for foundational stocks to only include those which met the following:

  • Stock must be a Dividend King (50+ years of annual dividend increases)
  • Dividend growth must have exceeded and have a reasonable expectation for continuing to exceed the annual rate of inflation.

My rationale was simple as well. The overall goal of the portfolio is to provide a safe and growing stream of income in retirement. She also want to sleep well at night (SWAN). A dividend king stock has proven to be resilient in all kinds of markets and economic conditions. As long as you can reasonably expect its business model to continue to be successful and its growth to exceed the rate of inflation nothing else should really matter.

I would also have fewer stocks in my foundation. Foundational stocks should be big, ‘cornerstone’ size investments. I would have more, smaller positions in my wall stocks and even more and smaller positions in my roof stocks.

After writing these comments, I decided I would spend some time coming up with what I thought would be a good foundation for a DGI portfolio.  However, before doing that I had to come up with a methodology for how I would build my own dividend house.

First, the foundation.  I previously referenced my simple criteria for selecting foundational stocks.  I also decided that foundational stocks would constitute 50% of my total stock portfolio and that each position would be less than 5% of the total stock portfolio.  Thus, my foundation would consist of no more than 10 stocks.

Next, are the walls.  The criteria for wall stocks is similar to those of the foundation.  The only difference being that the stock must be a Dividend Aristocrat, having increased its dividend annually for at least 25 years.  The walls would constitute 25% of my overall portfolio.

The criteria for stocks in the roof of my dividend house would consist of equities that have raised their dividends annually for at least 10 years.  In aggregate, they would constitute no more than 15% of my DGI portfolio.

Finally, I would also have a garden section of my dividend house.  This would consist of ‘up and comers’ in the world of DGI stocks.  They might not have any record of annual dividend increases but have the potential for rapid revenue growth and eventually might become consistent dividend growers as well.  The garden would constitute no more than 10% of my total DGI portfolio.

After building this framework I then spent some time determining what stocks should be placed in the foundation of my dividend house.  Using David Fish’s latest DGI spreadsheet which you can find here: http://www.dripinvesting.org/tools/tools.asp, I found that there are currently 27 companies that qualify as Dividend Kings, i.e. having raised their dividend annually for 50+ years.

As you might expect many of the names in this list are well known large cap stocks.  However, I also found several smaller, lesser known stocks which have very enviable dividend growth records.  To determine which 10 of the 27 stocks would best fit in the foundation of a DGI portfolio I decided to use the following criteria:

  • 10-year annualized growth rate of dividends
  • 10-year yield on cost (YoC), assuming investor had purchased stock 10 years ago at the 52-wk low.
  • 5-year YoC, assuming investor had purchased stock 5 years ago at the 52-wk low.
  • Free cash flow (FCF) payout ratio using the most recently available data. In most cases this was the fiscal year 2017 data, but in some cases was the trailing 12 months, and in a couple of cases was the 2016 fiscal year data.

7 of the 10 stocks selected were in the top 10 of the 10-year average growth rate of the dividend,
8 of 10 were in the top 10 of the 10-year highest yield on cost, 7 of 10 stocks selected were in the top 10 of the 5-year highest yield on cost, 4 of 10 were in the top 10 of the FCF payout ratio, and 3 of 10 were in the top 10 of all four criteria.  The results of my analysis are contained in the below table.

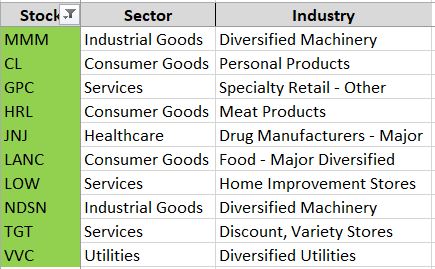
The 10 stocks I selected for the foundation of my dividend house, listed in alphabetical order are as follows:

  • Minnesota, Mining & Manufacturing (MMM), now more commonly known as 3M, is a large cap conglomerate which has increased its dividend annually for 60 years. I selected MMM because of its enviable ability, despite its size, to grow its dividend at a double digit rate.  It also has a very high 10-year YoC.
  • Colgate Palmolive (CL) is a well-known manufacturer of personal care products. It too, is a large cap stock.  It has increased its dividend every year for the past 54 years.  I selected it because of its high single digit growth rate in dividends as well as its leading position in a recession resistant industry.  People are never going to stop buying shampoo and toothpaste.
  • Genuine Parts Co. (GPC) is a lesser known but well respected manufacturer and retailer of replacement auto parts. It has increased its dividend annually for 61 years.  GPC is one of those companies that you rarely see mentioned on CNBC or on the lips of your friends as a stock tip at a cocktail party.  I selected it because it too is in a recession resistant industry and despite not being in the top 10 of 10-year average dividend increases, its annual dividend increases have handily outpaced inflation.  It also was in the top 10 for both 10-year and 5-year high YoC.
  • Hormel Foods (HRL) is a well-known name in the food manufacturing industry. It has raised its dividend for 52 years.  I selected it for its recession resistant business model and the fact that it was in the top 10 of all four of my selection criteria.
  • Johnson & Johnson (JNJ) is one of the most well-known and respected companies on the planet. It is a large cap stock that is diversified across the healthcare and pharmaceutical industries.  It has raised its dividend annually for 55 years.  I selected it for its consistent growth.  In my opinion, no DGI portfolio would be complete without it.
  • Lancaster Colony (LANC) is an amazing hidden gem. Like HRL, it operates in the food manufacturing industry.  It has zero debt and has raised its dividend for 55 years.  I selected LANC for its conservative balance sheet and its focus on returning capital to its shareholders.  Not only does this company pay out a growing annual dividend, it also pays out a special dividend every few years.  The past couple of times the special dividend alone has equaled 5%!
  • Lowe’s (LOW) is the well-known home improvement retailer. This large cap stock has also increased its dividend for 55 years.  I selected it because it was one of only three stocks that were in the top 10 of all my criteria.
  • Nordson Corp. (NDSN) is another one of those hidden gems I found. Prior to doing this research I had never before heard of it.  It is a manufacturer of packaging machinery.  It has increased its dividend every year for 54 years.  Despite it having a very low initial yield, it has one of the highest 10-year YoC.
  • Target (TGT), like JNJ and LOW, is another one of those household name stocks. It operates as a big box retailer.  It has increased its dividend for 50 years.  I selected it because despite its well published hiccups of the past several years (data security and amazon competition) it has managed to continue to rapidly grow its dividend.  It was also one of the 3 stocks which were in the top 10 of all of my criteria.
  • Vectren (VVC) is a lesser known utility stock. It operates both regulated gas and electric utilities in the Midwest.  It has increased its dividend annually for an amazing 58 years.  I selected it as the one utility in my foundational portfolio and also because of its conservative, slow growth, operations.

Before wrapping up this post I want to briefly comment on two prominent Dividend Kings that are conspicuously missing from my pick of foundational stocks.  They are Coca Cola (KO) and Procter & Gamble (PG).  Both of these companies, while continuing their streak of annual dividend increases, 55 and 61 years respectively, have faltered in the past several years.  Neither company was in the top 10 of any of my selection criteria.  I own KO in my current portfolio and as a result of this analysis I am considering replacing it.

Best Regards,

Troy

Posted in Troy's New Picks! | Tagged: , , , , , , , , , | 2 Comments »

About my long-term holdings

Posted by mounddweller on January 3, 2018

Fellow Investors,

The post today is a few words regarding the long-term holdings portion of my portfolio.  Looking at the data in the “Long Term Holdings” tab you can see that I began accumulating these positions about 10 years ago.

My thought at the time was to begin accumulating large cap, dividend growth stocks at reasonable prices as the opportunity presented itself.  Then, I would automatically reinvest the quarterly dividends until such time as I was ready to retire and begin cashing those quarterly dividend checks.  Since these were ‘buy and hold forever’ stocks I tried to ignore month to month fluctuations in price.  I feel the plan has been successful.  The portfolio now has 15 stocks, 11 C-Corps and 4 MLPs.    My strategy has been to buy when the stock is currently out of favor.  Doing so has allowed me to buy AT&T at an average cost of less than $32/share, Exxon Mobil at $73, Intel at $24, McDonald’s at around $94, and Microsoft around $29.  With all of these companies increasing their dividends per share on an annual basis my yield on cost is substantial and will only continue to increase.

So, you may be wondering what I currently have on my watchlist.  As you might expect, given the current market conditions, not much!  However, there are a few companies that I would like to add to the portfolio if the opportunity presents itself.  IBM is one such company.  I’ve looked and passed on it multiple times in the past couple of years when the dividend yield exceeded 4%.  22 straight quarters of declining revenue make me a bit nervous to pull the trigger.  However, I think they may be very close to putting this bad string of results behind them.  If they have a good 4th quarter of 2017 and we get even a mild correction in the market, I’d buy a small number of shares at $150 or less.

Another stock I have my eye on is OKE.  It is a large mid-stream oil and gas pipeline company headquartered in Oklahoma.  It has excellent growth prospects and despite jumping in the first couple days of trading in 2018 still yields a very respectable 5.4%.  I didn’t anticipate it jumping out of the gate in the new year and so now will wait for it to cool off and pull back a little bit.  I will be pleased if I can get it at $53/share or less.

Well, that’s it for this post.  Later this week I hope to introduce you to the real estate portion of my portfolio.

Regards,

Troy

Posted in Long Term Holdings | Tagged: , , , , , , | Leave a Comment »